Why a blanket rule misleads
Most sales systems can list customers with no order in the last 90 days. It feels like a lapsed-customer report, but it answers a different question. A pallet-wrap customer who orders every four months will be on the list every time, whether or not anything has changed. A customer who buys tape and film every week and has not ordered for three weeks will not appear at all, and by the time they cross 90 days the business may already have gone elsewhere.
The useful question is not “who has not ordered in 90 days” but “who is later than they usually are”. That needs two numbers per account: how often they normally order, and how long it has been since they last did.
The export fields you need
You do not need a data warehouse. A sales export by order line is a workable starting point, with something like the last twelve to eighteen months as an initial sample, provided it contains these fields:
- Customer code, not just the name, so branches and renamed accounts are not mixed up.
- Order date or invoice date. Pick one and use it consistently.
- Document type, so quotes, pro formas, credit notes and cancelled orders can be told apart from real orders.
- Product code and a way to tell consumables from machinery and spares.
- Quantity and net value, so the list can be sorted by what matters.
- Returned or cancelled flag, if your system has one. If not, the document type will have to do.
If a field is missing, say so before building anything. A report built on the wrong document type will look fine and be quietly wrong.
Each account’s usual interval
For each customer, list the dates of their real orders in the period and work out the gap between consecutive orders. Take the median of those gaps, not the average, because one long summer break should not stretch a weekly customer into a monthly one. Orders on the same day count once.
Then decide on a minimum. Two orders in a year are limited evidence of a rhythm. As an illustrative starting rule to test with the team, three or four real orders is a floor, with accounts below it reviewed separately as new or occasional.
The comparison is then simple: days since the last order divided by the usual interval. The ratios in this article are illustrative starting rules to test with the team, not validated thresholds: anything over about 1.5 might be worth a look, and anything over 2 a clearer prompt. The real thresholds are a decision for your sales team, and they can differ by product group.
Returns and cancellations
Credit notes and return transactions are not new purchase events, so they must not be counted as orders. But they should be reconciled to the original order rather than used to delete it. A customer who kept most of a delivery and sent two damaged rolls back still placed a genuine reorder, and that order date stays in the interval calculation. Agree rules with the team for the three cases: a full return, a partial return and a cancellation. A common starting point is to drop an order only when nothing of it was fulfilled, and to adjust quantity and value for partial returns while keeping the date. Accounts with a recent return are worth listing separately, because that is a different kind of conversation.
Seasonality
Some accounts pause every August or every December. Some horticultural and food customers order in bursts. A simple safeguard is to compare the current gap with the same period last year: if the customer also went quiet in the same weeks twelve months ago, lower the urgency rather than removing them from the list. A more careful approach is to let the sales team mark known seasonal accounts and their usual pauses, and to review those marks once a year.
Machinery versus consumables
A customer who bought a pallet wrapper in March has not lapsed because they did not buy another one in June. Base the ordering interval on consumables and repeat lines only. Machinery and one-off equipment sales should be excluded from the interval calculation and shown as context instead, because a recent machine sale often means more film, not less. Spares are irregular by nature and are better handled as their own small list.
A worked example
Illustrative example, invented data
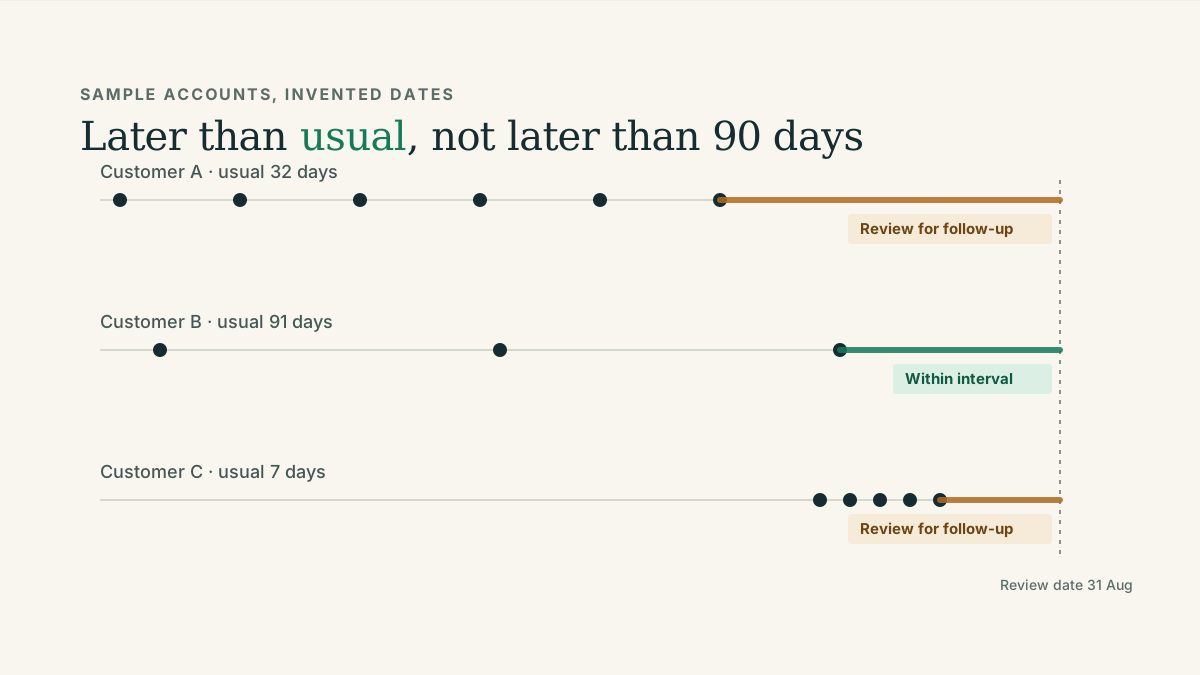
Review date 31 August 2026. Three sample accounts, consumable orders only, returns already excluded.
| Sample account | Real orders in 2026 | Gaps (days) | Usual interval | Last order | Days since | Ratio | Review |
|---|---|---|---|---|---|---|---|
| Customer A | 6 Jan, 3 Feb, 7 Mar, 4 Apr, 6 May, 8 Jun | 28, 32, 28, 32, 33 | 32 days (median) | 8 Jun | 84 | 2.6 | Review for follow-up |
| Customer B | 12 Jan, 14 Apr, 13 Jul | 92, 90 | 91 days | 13 Jul | 49 | 0.5 | Within interval |
| Customer C | Weekly, last four: 20 Jul, 27 Jul, 3 Aug, 10 Aug | 7, 7, 7 | 7 days | 10 Aug | 21 | 3.0 | Review for follow-up |
Ratios and the review labels are illustrative. Customer B orders roughly every three months, so a fixed 90-day threshold can flag quarterly buyers close to their normal reorder date; at this review date B is 49 days on and needs no follow-up. A 90-day rule would miss Customer C entirely at this review date, yet three missed weekly orders is the strongest signal of the three.
Notice what the ratio does not tell you. Customer A may have a stock build-up, a price query sitting in someone’s inbox, or a new buyer who has not been introduced yet. The report finds the account; a person finds the reason.
The weekly human review
Run the list once a week, on the same day, and have the account manager or sales lead read it before any calls are made. The review does three things. It removes accounts the team already knows about. It adds context the export cannot hold, such as a holiday, a dispute or a customer who has moved to a different branch. And it records the outcome, so next week’s list shows what was done last week.
Record the outcome in a plain column: called, emailed, no action, seasonal, closed. Over a few months those outcomes tell you whether the thresholds are set well.
Where a reporting assistant fits
Everything above can be done in a spreadsheet by someone with time and patience. The difficulty is doing it every week, the same way, with the exclusions applied correctly and the totals checked. That is the job a reporting assistant is configured to do: read the export you already run, apply the rules your team has agreed, and produce the short list with the workings visible.
This workflow can be scoped around your exports and the way your team reviews accounts. The figures above are invented to show the method. It is one of the three workflows described on the reporting assistants page, and the example on the home page shows the style of output with invented data. The checks that make it trustworthy, complete rows, the correct document and reconciled totals, are covered in why the same stock can look different across product codes.